89
Fundus autofluorescence in age-related macular degeneration
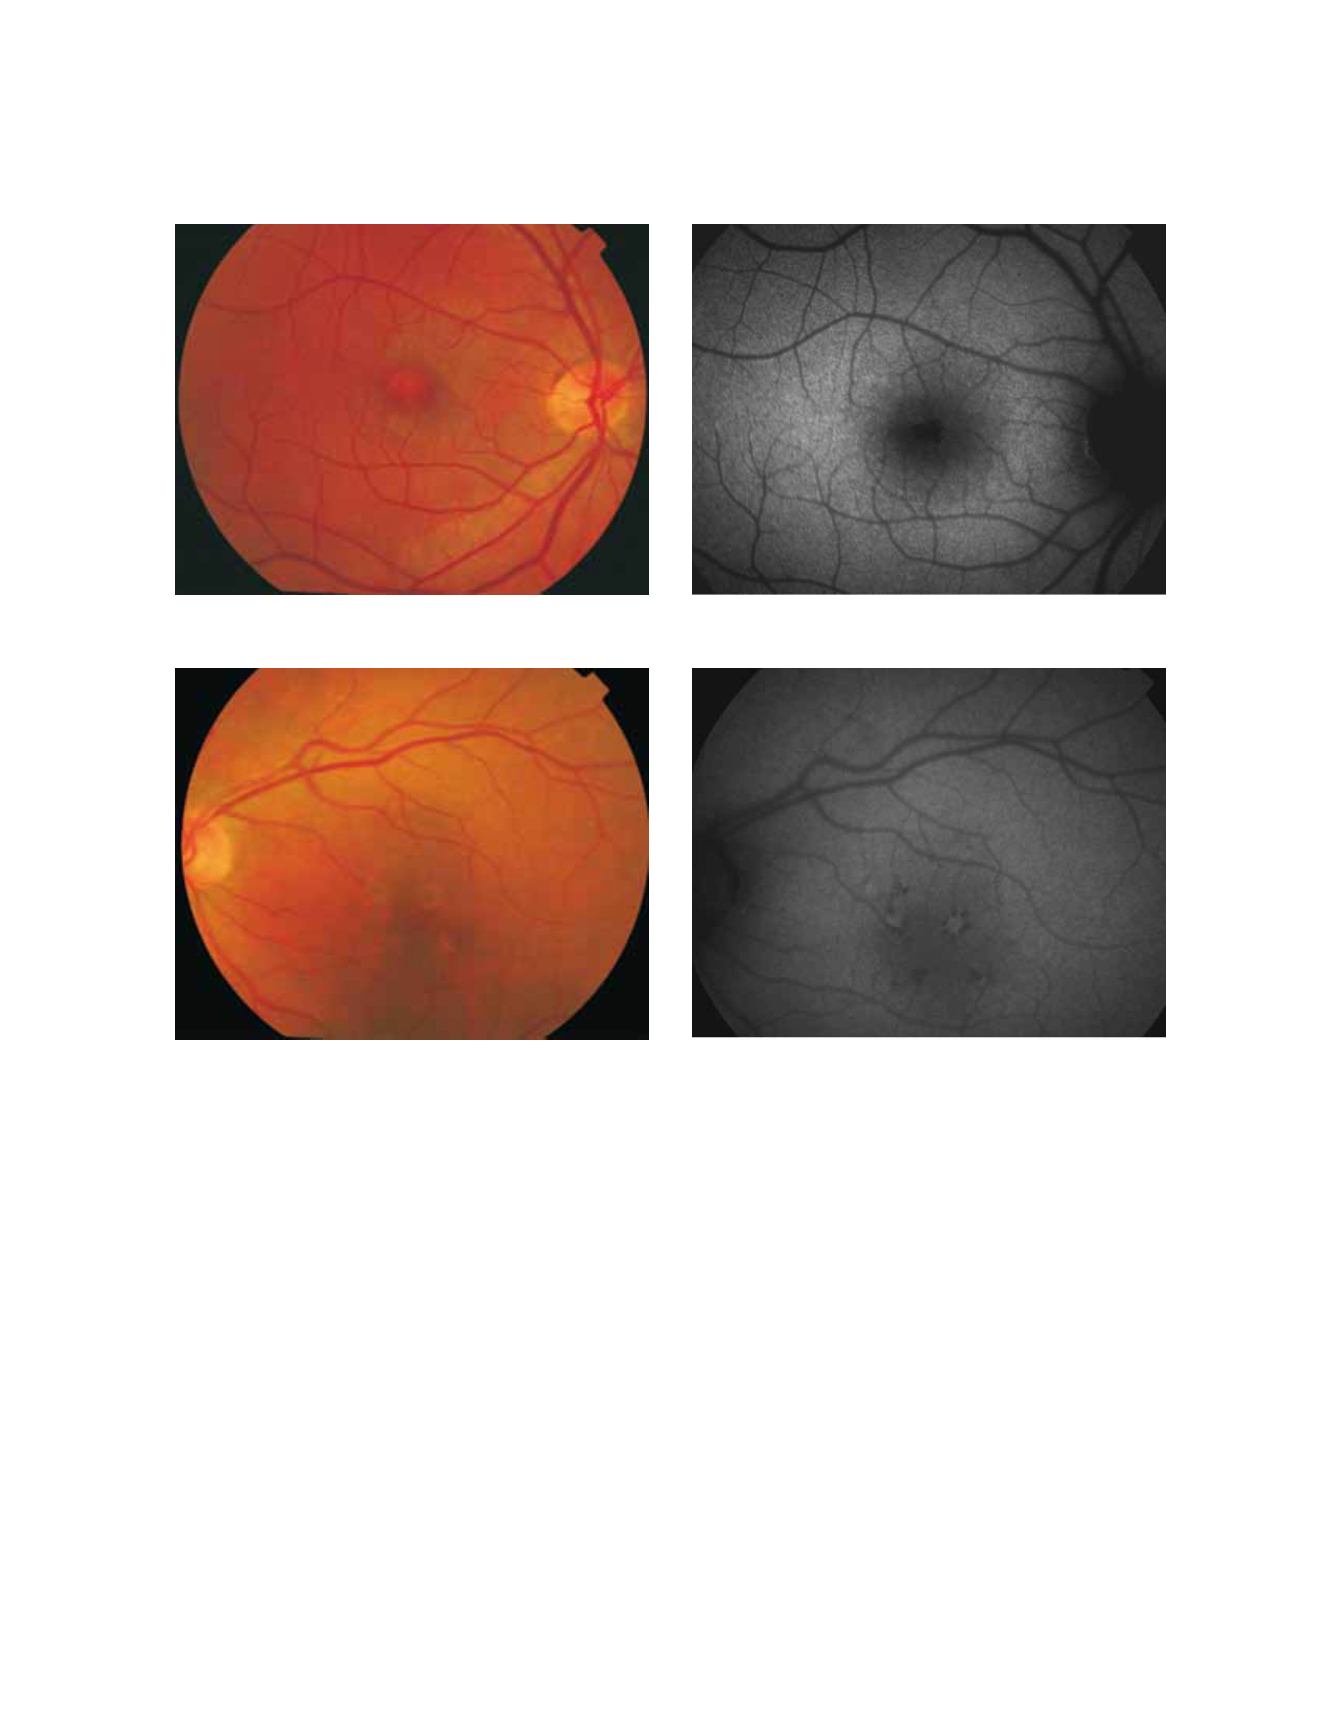
Figure 8 - RPE hypopigmentation in the macular area secondary to AMD. (A) Colour fundus and (B) fundus autofluorescence photographs.
A
B
more precisely than colour fundus photographs, per
mitting a clearer and more specific study of GA, as well as
its natural development and evolution
(38,44)
(Fig. 10 and
11).
The GA patches usually become larger and coalesce as
AMD progresses
(45,46)
. An excessive accumulation of
LF, and therefore an increased FAF in the junction are
highly suggestive of the appearance or progression of pre-
existing GA (Fig. 12). Preliminary observations suggest
that different phenotypes may appear associated with
junction FAF changes
(47)
. Recently, a new classification
for junction FAF patterns has been proposed in GA
patients
(48)
(Fig. 13).
-Focal increased autofluorescence
is defined by sin-
gle or multiple spots of focal markedly increased FAF
localized at the border of the atrophic patch.
-Band pattern of increased autofluorescence
is charac
terized by a continuous stippled band of increased FAF
surrounding the entire atrophic area.
-Patchy increased autofluorescence
are large patches of
increased FAF outside the GA area. FAF tends to be less
intense than that in the focal pattern described above.
-Diffuse increase autofluorescence
is the most frequent
pattern of incresed FAF in eyes with GA. FAF changes
are not limited to the border of the atrophic area and
may show inter individual differences that have been fur
ther classified into four subtypes.
-Reticular pattern,
characterised by several lines of
increased FAF usually following a radial pattern.
-Branching pattern
shows a diffusely increased FAF
Figure 9 - RPE hyperpigmentation in the macular area secondary to AMD. Areas with hyperpigmentation frequently show a higher FAF signal
which may be caused by a higher amount of autofluorescent melanolipofuscin. (A) Colour fundus and (B) fundus autofluorescence photographs.
A
B


