88
drusen.
The speckled pattern has been reported to be the most
frequent (26%) followed by the patchy pattern (23%).
The most infrequent patterns are the normal pattern
(2%) and the lacelike pattern (2%). The study confirmed
that visible drusen on fundus photography are not always
correlated with noticeable FAF changes and that areas of
increased FAF may or may not correspond to areas of
hyperpigmentation or soft or hard drusen.
Several authors have also mentioned the different FAF
patterns in eyes with drusen. Delori et al. described a
pattern consisting of decreased FAF in the centre of
the drusen surrounded in most of the cases by a ring of
increased FAF
(27)
. They also observed that the decreased
drusen signal was not as intense as in the areas with
RPE atrophy. The authors hypothesized that it might be
caused by a displacement of the cytoplasm and LF gran
ules in RPE cells instead of an actual RPE atrophy
(35)
.
Von Rückmann et al. further reported that crystalline
drusen are characterised by a decrease in FAF signal, sig
nalling the onset of atrophy. Lois et al. confirmed that
areas of confluent drusen are usually associated with
focal, mildly increased FAF and that only large subfoveal
soft drusen (drusenoid RPE detachments) topographi
cally correspond with focal changes of FAF
(33)
(Fig. 6).
Smith et al. recently reported their results after using
image analysis software to study drusen and pigmented
areas on fundus photographs from AMD patients
(41)
. The
authors initially used image analysis algorithms, includ
ing automated background levelling and thresholding.
Areas of focally increased FAF intensities were compared
to the normal background signal. By overlapping fun
dus photographs and FAF, the topographic correlation of
drusen and pigmented areas with focally increased FAF
signals was established. Smith and co-workers reported
that eyes with isolated drusen or pigment abnormalities
were better correlated with FAF abnormalities than eyes
with geographic atrophy
(41)
.
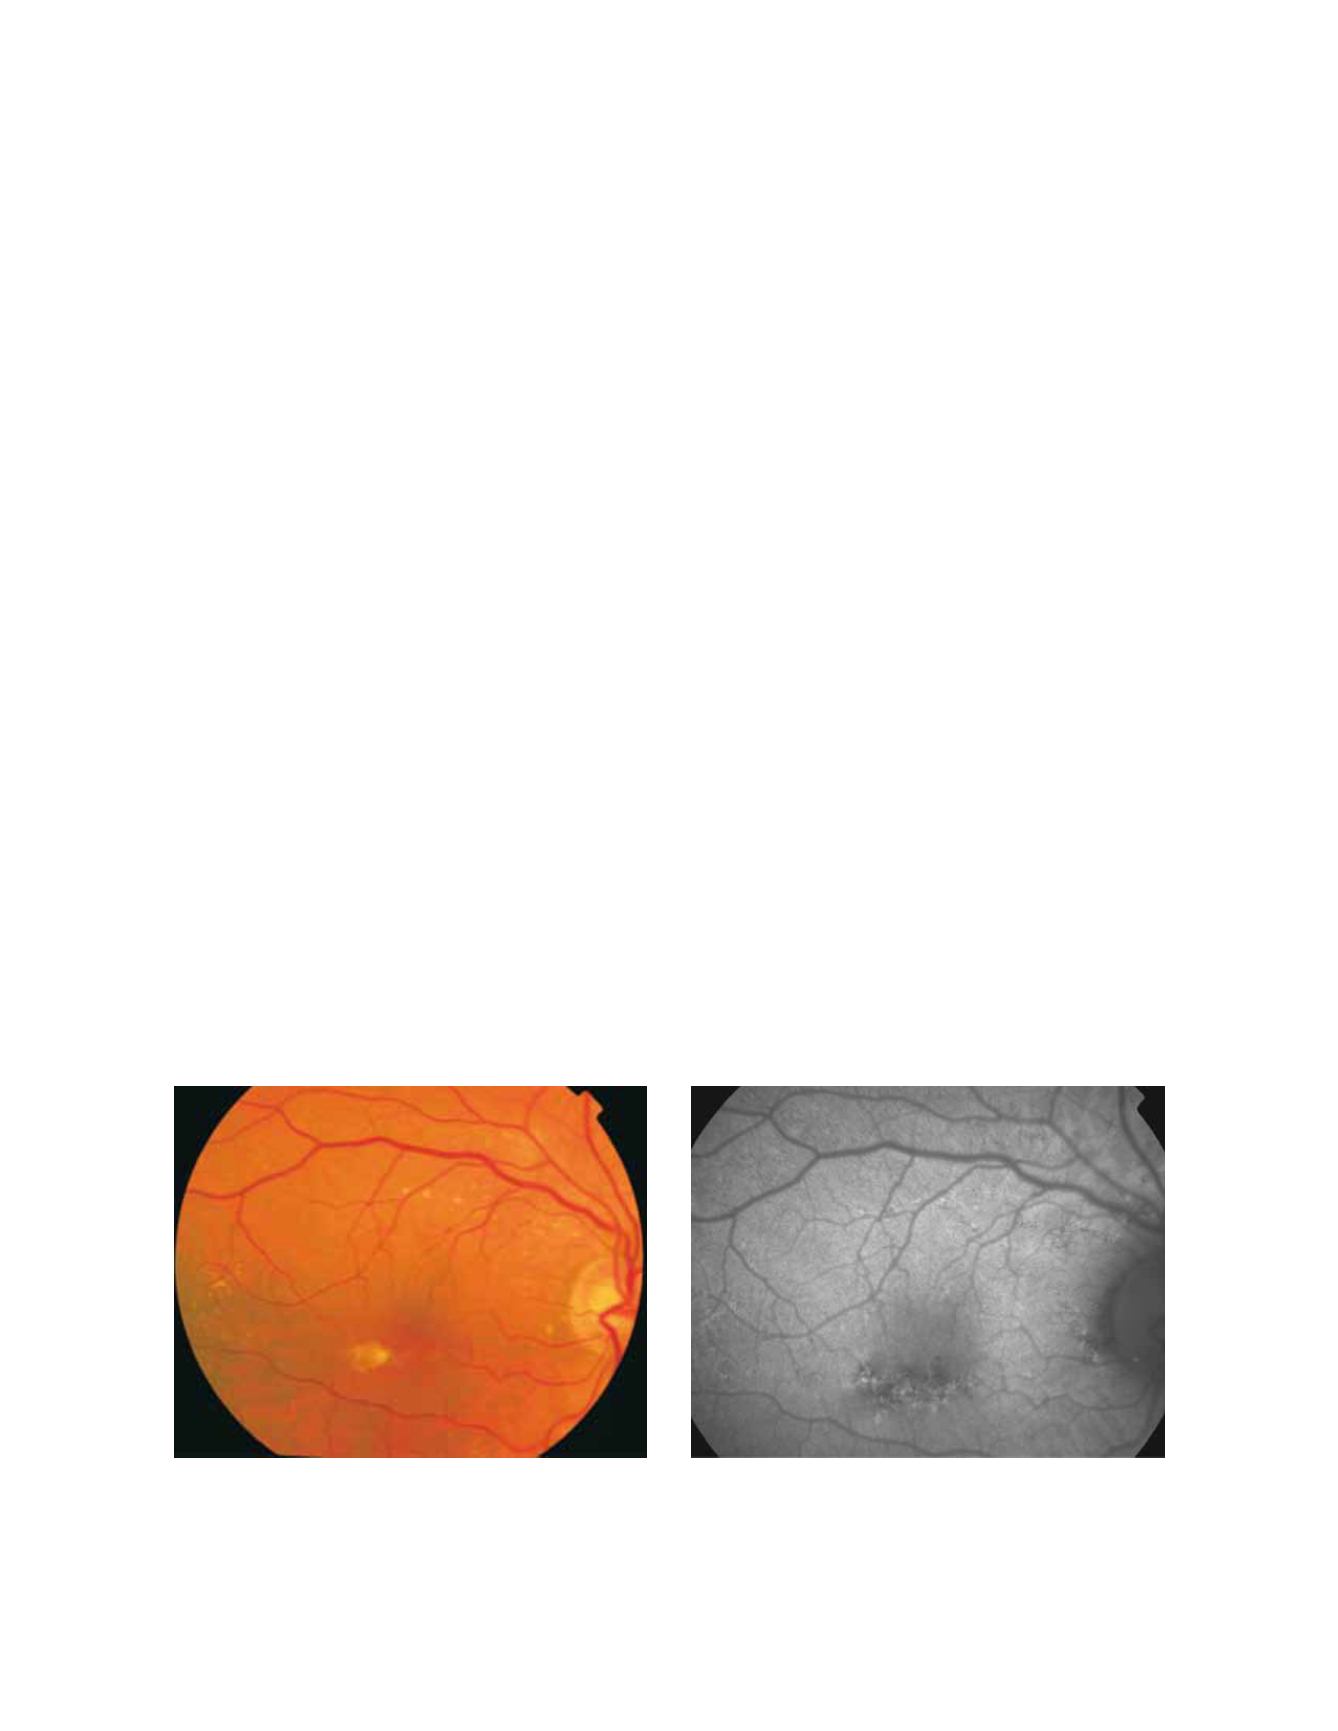
Regarding areas with changes in RPE, hypopigmented
areas are usually associated with a corresponding decreased
FAF signal, suggesting an absence or degeneration of RPE
cells, with reduced content of LF granules. (Fig. 7 and 8).
However, hyperpigmented areas frequently show a higher
FAF signal, which may be caused by a higher concentra-
tion of autofluorescent melanolipofuscin
(35)
(Fig. 9).
3.2.2 Advanced AMD
Advanced AMD is characterized by geographic atrophy
(GA), choroidal neovascularization (CNV), pigment epi-
thelial detachment (PED), RPE tears and disciform scars.
3.2.2.1 Geographic atrophy
Geographic atrophy is thought to be the natural end
stage of the atrophic AMD process when CNV does not
appear. GA occurs in areas where the RPE is dead and
the outer neurosensory retina and choriocapillaris disap
peared
(42, 43)
.
Due to the loss of RPE and LF, the atrophic area appears
dark in FAF imaging
(35)
. High contrast between the atro-
phic and the non atrophic retina defines the area of GA
Figure 7 - RPE hypopigmentation in the macular area secondary to AMD. Hypopigmented areas are usually associated with correspondingly
decreased FAF signals, suggestive of RPE cells loss or degeneration with reduced content of LF granules. (A) Colour fundus and (B) fundus
autofluorescence photographs.
A
B


