110
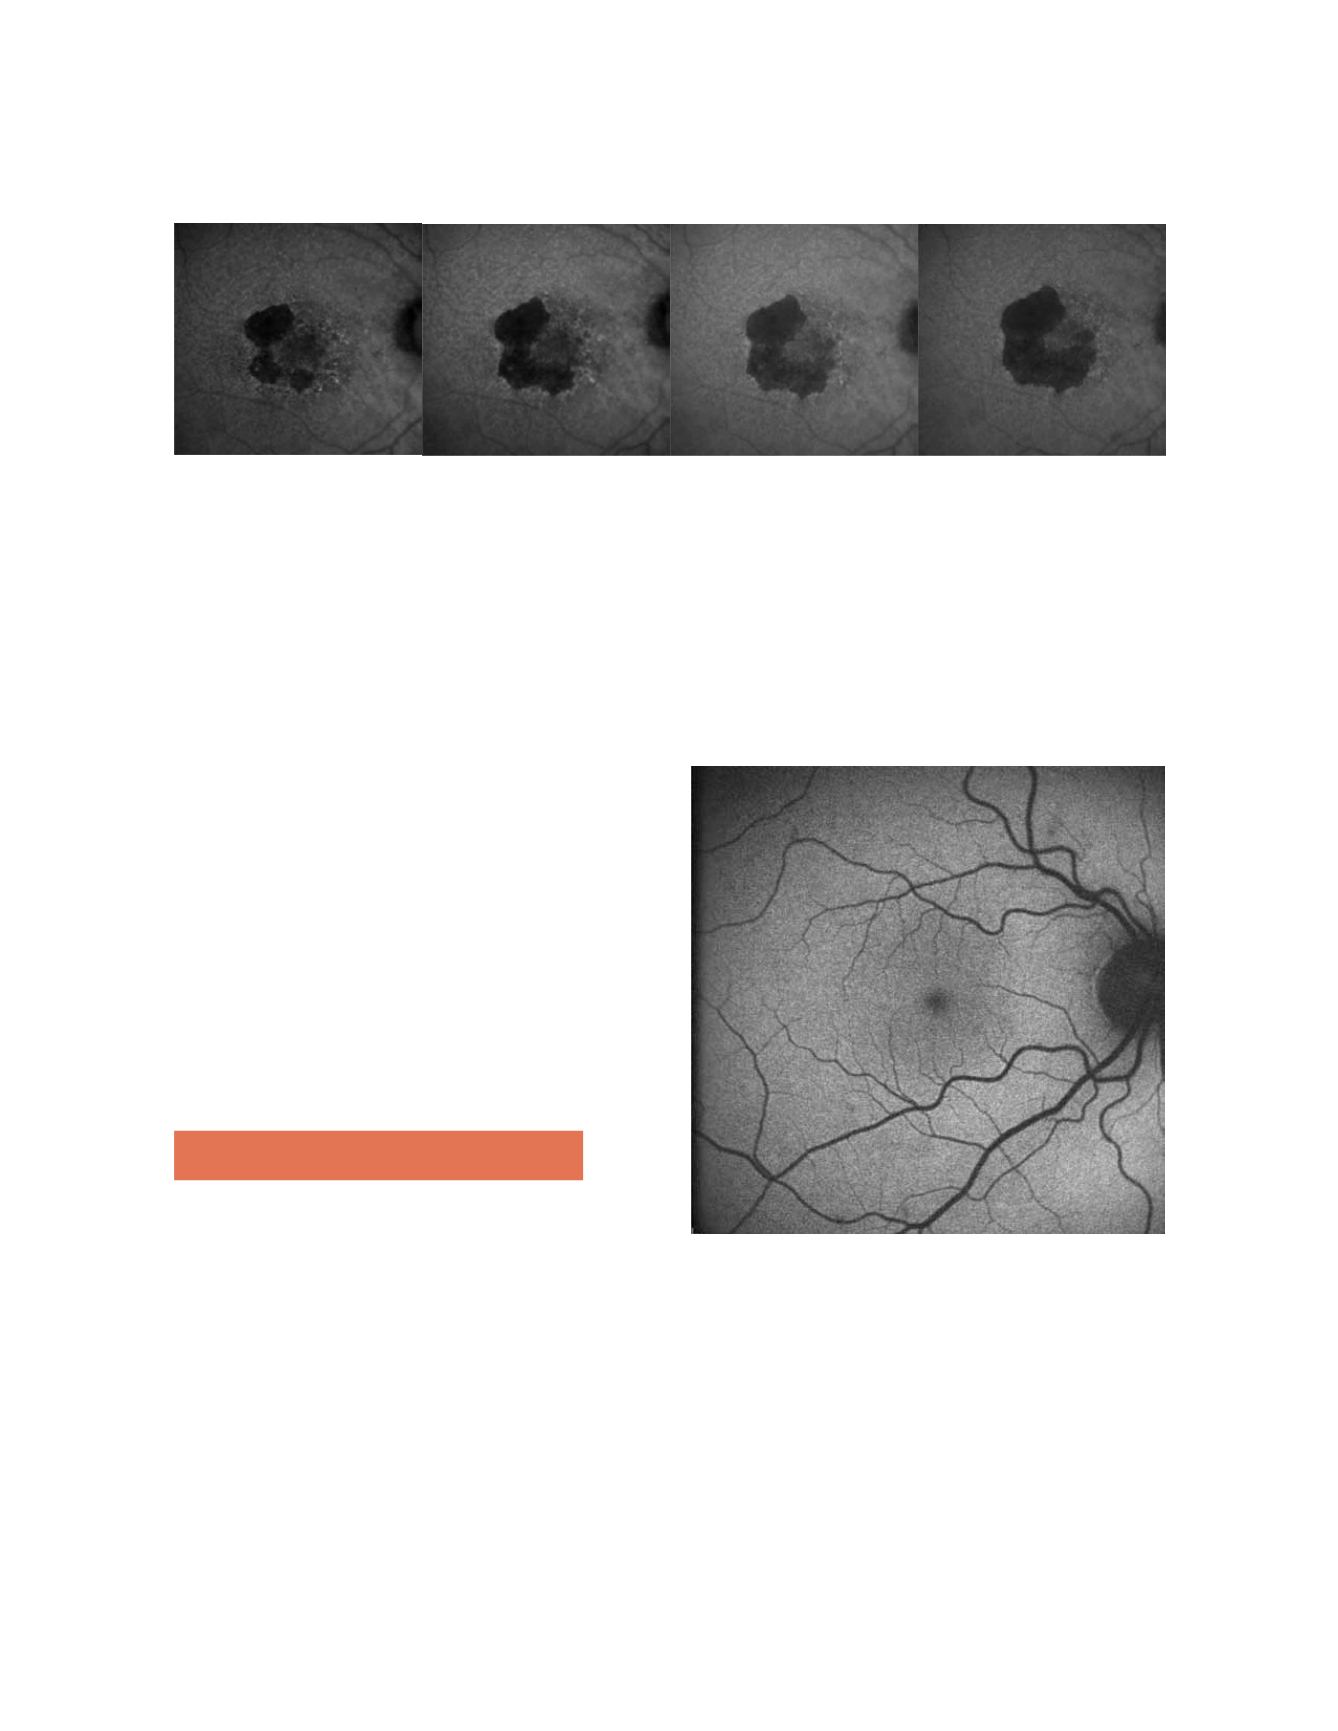
Figure 2: GA atrophy progression in one year of the right eye of the same patient (fundus autofluorescence images )
It remains a significant challenge because of its poten-
tial to cause blindness, its relentless progression and the
lack of current effective treatment. With the progressive
increase of the longevity in developed countries GA sec-
ondary to AMD represents a true epidemic.
Recent research has pointed towards lipofuscin, a fluo-
rophore that accumulates in the RPE, as a triggering
agent in the development of atrophy. Lipofuscin derives
mainly from phagocytosed photoreceptor outer seg-
ments and accumulates in RPE lysosomes, where
one of its many compounds, A2E (N-retinylidene-
N-retinylethanol-amine), increases the pH by inhibi-
tion of ATPase proton pump function, difficulting its
phagocitation and inducing cellular apoptosis
(6,7)
. Using
a fundus spectrophotometer, Delori et al.
(8,9)
were able to
visualize lipofuscin due to its autofluorescent properties
(when stimulated with blue light in the range of 488 nm,
lipofuscin emits a yellow fluorescence). Current develop-
ments allow the clinical in vivo visualization of the distri-
bution of lipofuscin by means of confocal scanning laser
ophthalmoscope (cSLO) or specific filters in the fundus
cameras.
2. Fundus autofluorescence
Fundus autofluorescence (FAF) is a novel, non-inva-
sive method for imaging the fluorescence properties of
lipofuscin (and possibly other molecules with a range
of absorption and emission spectra close to that of this
fluorophore) at the level of the RPE. Using a commer-
cially available cSLO, the distribution of FAF in the
normal eye can be seen in Fig. 3. It is characterized by
a uniform grayish signal in the fundus and a marked
dark appearance in the optic nerve (absence of RPE) and
retinal vessels (absorption of fluorescence by hemoglo-
bin and other blood contents). The macular area shows
progressive diminished signal intensity towards the fovea
because of absorption phenomena of short wavelengths
by macular pigment, lutein and zeaxanthin. A relatively
high degree of inter-individual variability and technical
difficulties limit the use of the absolute quantification of
pixel gray values for longitudinal or transversal studies,
and therefore the interpretation of the images is based
on qualitative observations, ie decreased (dark), normal
or increased (white) FAF, in a similar way to that of con-
ventional fluorescein angiography.
Figure 3: Normal fundus autofluorescence: uniform grayish signal in
the fundus and a marked dark appearance in the optic nerve (absence
of RPE) and retinal vessels (absorption of fluorescence by hemoglobin
and other blood contents)
A decreased signal is commonly due to RPE atrophy
(absence of lipofuscin), an increase in RPE melanin
content and absorption from extracellular material
anterior to the RPE (intraretinal fluid, fibrosis and
media opacities, being cataract a common cause of
decreased FAF intensity and poor image quality, spe-
cially with cSLO). On the other hand, an increased


