111
Fundus autofluorescence patterns and optical coherence tomography in geographic atrophy secondary to AMD
signal may be due to lipofuscin accumulation in the
RPE (which is the main fluorophore in FAF imaging),
presence of other fluorophores not in the RPE (drusen
-including those in the optic nerve head-, older hemor-
rhages), lack of absorbing material and artifacts
(10)
.
FAF imaging in patients with GA is characterized by
a decreased signal with sharp borders corresponding
to the area of atrophy on conventional retinography
(Fig. 4). However, many patients show increased FAF
at the borders of atrophy (Fig. 5), which has been histo-
pathologically confirmed as areas of increased lipofus-
cin-filled RPE cells between atrophic and normal retina.
This finding has not been identified by any other imag-
ing modality. Holz et al. showed in a longitudinal study
that atrophy developed selectively in the junction areas
of increased FAF
(11)
but not elsewhere, a finding that
could not be confirmed on a small sample by Hwang
et al.
(12)
. Based on this information, the FAM (Fundus
autofluorescence in age-related macular degeneration)
study initially described 8 patterns of FAF in the junc-
tion zone of GA
(13)
, which were later modified to incor-
porate a nineth pattern
(Fig. 6)
(14)
. According to FAF
in the junction zone of atrophy, eyes are classified as
none (when there is no increased FAF at the borders of
the GA), localized (focal, banded, patchy) and diffuse
(fine granular, branching, trickling, reticular and fine
granular with punctuated spots)
(14)
.
The relevance of these patterns relays in the fact that
they may represent different phenotypic manifes-
tations of the disease. It has been shown in natural
history studies that rates of growth differ between
subtypes of FAF and that a strong correlation exists
between FAF pattern and progression of atrophy in
GA
(14,15)
. In the FAM study
(14)
195 eyes of 129 patients
with GA were followed a median of 1.80 years and
classified according to FAF pattern at baseline. Those
without abnormal FAF at the borders of the lesion
experienced the slowest progression over time (0.38
mm2 /year, n = 17) compared to those with the focal
(0.81 mm2 / year, n = 14) and diffuse (1.77 mm2
/ year, n = 112) subtype (p<0.0001). FAF was more
strongly associated with GA growth than other classic
risk factors, such as size of baseline atrophy, smok-
ing, age or family history. Nowadays current devices
of autofluorescence equipped with semiautomated
software allow quantification of total area of GA and
measurement of its progression in time (Fig. 7).
Furthermore, studies using fine-matrix mapping
(16)
and SLO microperimetry
(17)
have found impaired
rod photoreceptor function and photopic sensitivity
respectively in areas of increased FAF in the junction
zone, which underscores abnormalities associated
with increased fundus autofluorescence.
Taken together, these results suggest that presence of
increased FAF at the borders of GA is associated with
a greater rate of progression of atrophy and that dif-
ferent patterns of FAF may reflect differences at the
cellular and molecular level that may explain the dif-
ferent evolution of the disease process. This informa-
tion is relevant for understanding its physiopathol-
ogy, natural history and to evaluate future therapeutic
strategies.
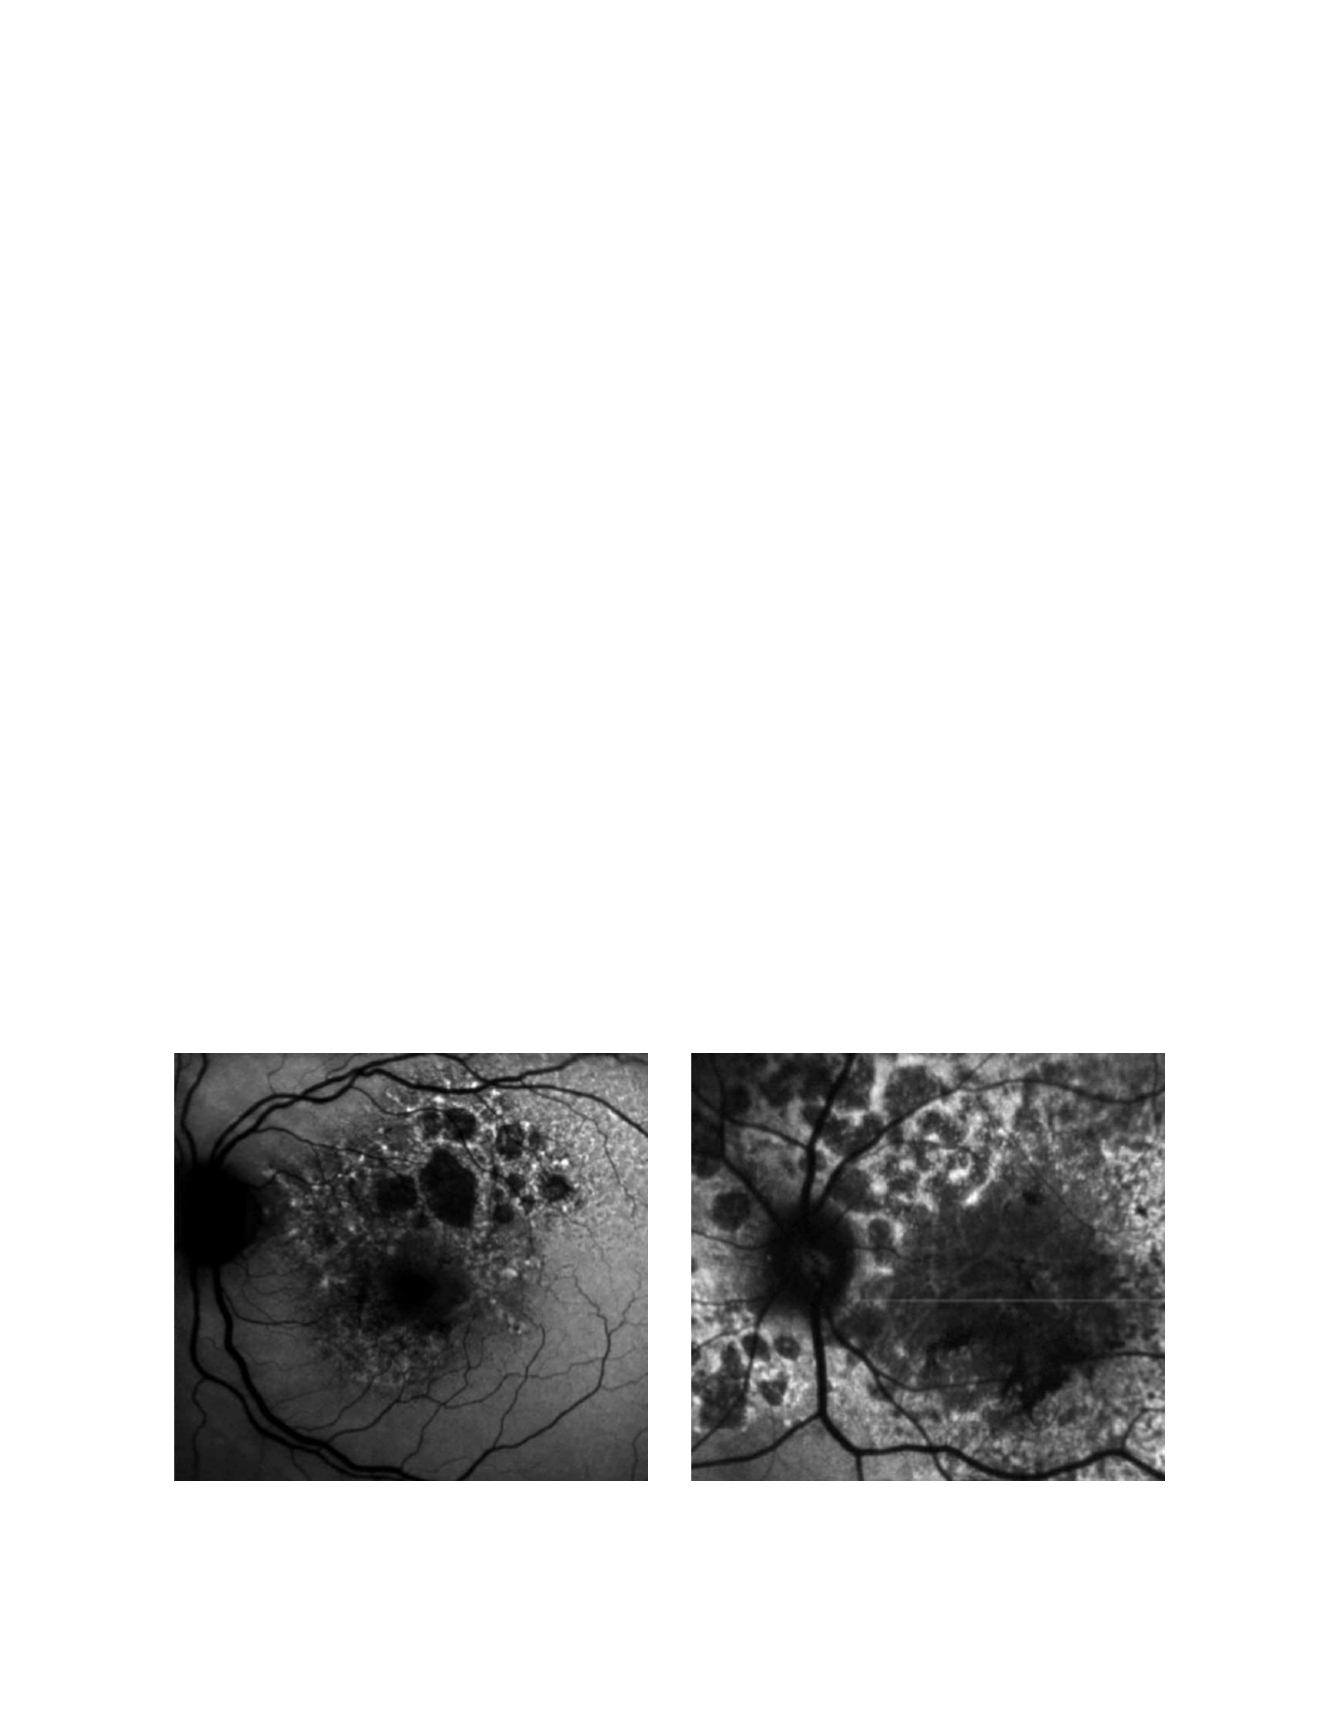
Figure 4: Fundus autofluorecence of patients with GA secondary to dry AMD. Atrophic areas show hipoautofluorescence. Borders of the lesion show
hyperautofluorescence due to the accumulation of lipofuscin


